Contents
- 1Introducing the Xilence XP400R6
- 1.1Packaging and accessories
- 2Connectors & cabling
- 2.1Casing & cooling
- 3Input filtering
- 4Primary side
- 4.1+5 V stand-by rail
- 5Secondary side
- 5.1Build quality
- 6Load testing
- 6.1Loading +5 V SB
- 6.2Voltage hold-up time
- 6.3Combined loading
- 6.4Combined loading ripple
- 6.5Crossloading, overloading
- 6.6Crossloading, overloading ripple
- 6.7Fan speed and temperatures
- 7Conclusion and evaluation
- 7.1Discussion
Load testing
Loading +5 V SB
As always, all load testing is done in accordance with our testing methodology. There has been just one small change. Now we’re using a different watt-meter, namely the Electrobock EMF-1. Besides it having a resolution of 0.1 W, I imagine that it is essentially the same as all the other inexpensive wall watt-meters. We see that the voltage regulation corresponds with mainstream units, it is within ±3 %.
| Output (W) | Load (A) | Voltage (V)/ ripple (mV) | Input (W) | Efficiency/power factor |
| 0 | 0 | 5.12/10.4 | 0.2 | —/0.01 |
| 14.62 | 2.93 | 4.99/11.2 | 19.4 | 75.4 %/0.50 |
| 16.98 | 3.42 | 4.96/11.6 | 22.7 | 74.8 %/0.52 |
Ripple suppression is also worse and the efficiency is around 75 %. Still mainstream figures.
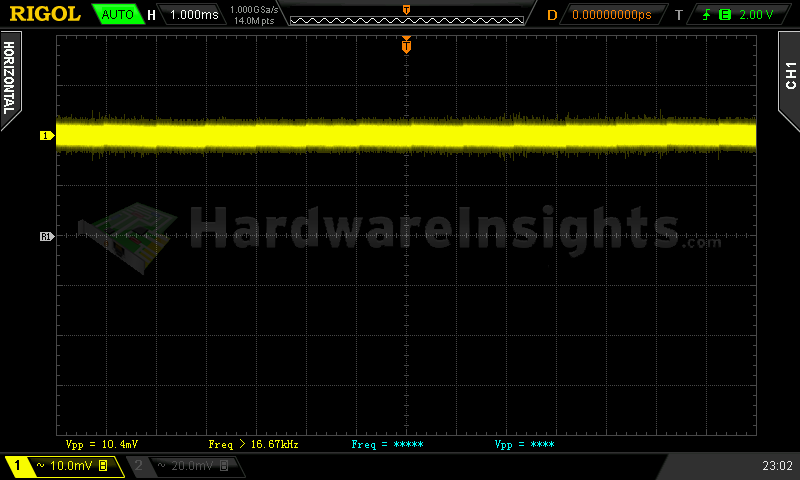
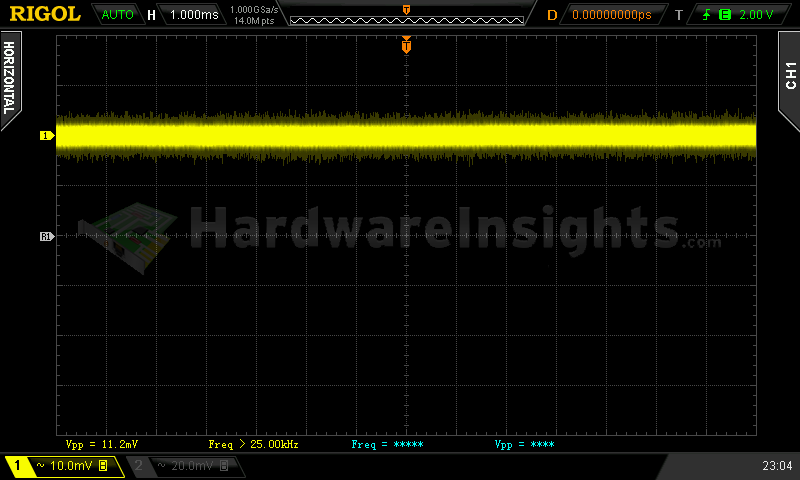
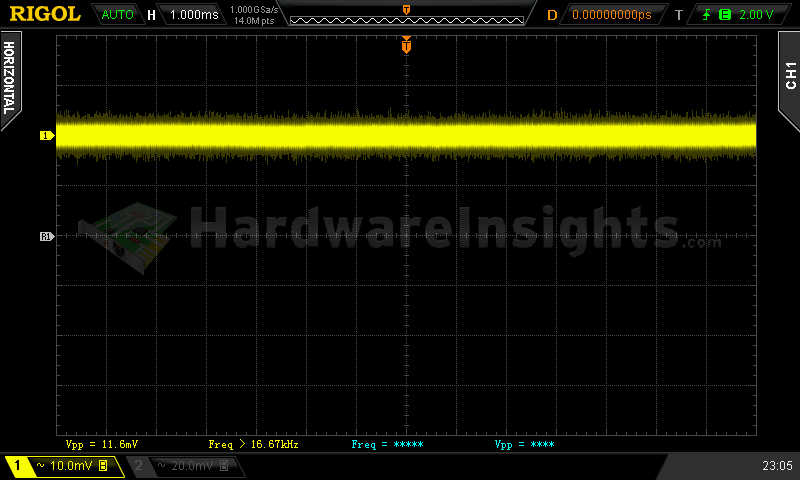
+5 V SB ripple (left to right): 0 A; 2.93 A; 3.42 A
Voltage hold-up time
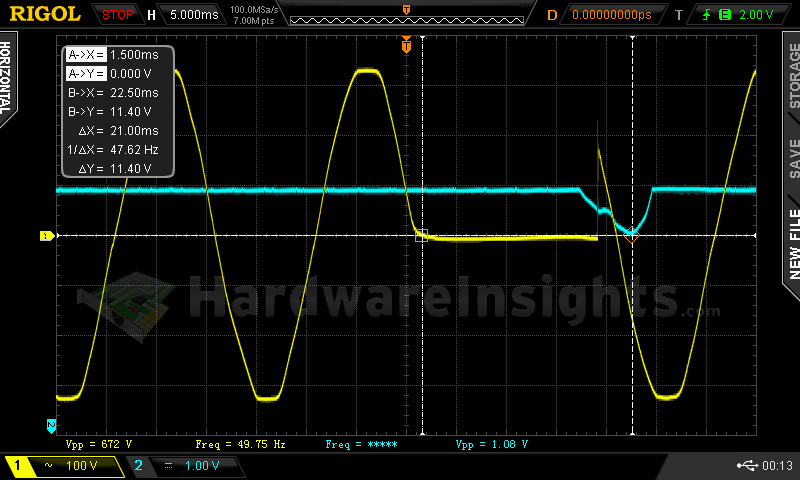
As we can see on the oscilloscope screenshot, the hold-up time of the +12 V rail is OK, precisely 19.8 ms. Not that bad.
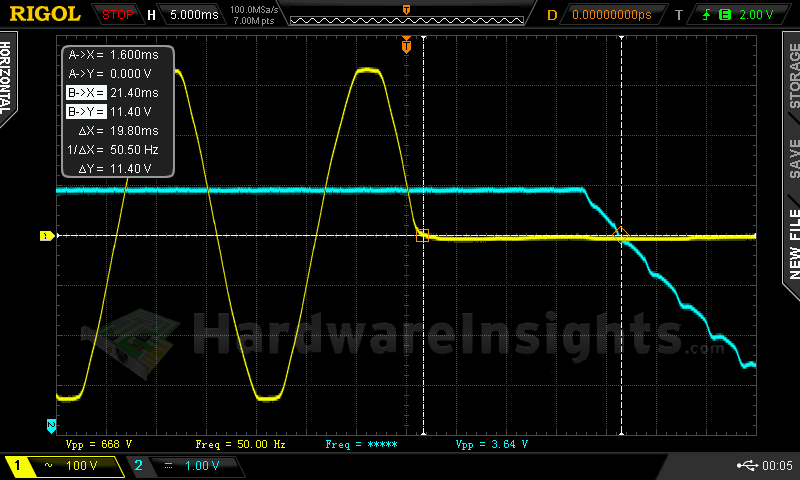
Trying to interrupt the power for 19.8 ms revealed that there is still some voltage drop even after the power is restored, so to stay within the specification, the minimum I had to set it to was about 18 ms. So this is the absolute maximum time for this unit to stay within spec in case of a black out, under full load (250 W). Any UPS would have to kick in and restore the power within 18 ms.
Combined loading
Combined loading tests went OK for the Xilence Performance C XP400R6. Firstly, let’s talk about the voltage regulation. As this is a group design it is pretty obvious that the regulation will be only so-so when all the rails are properly loaded. I had a little trouble performing this test in 50 W increments, so I had to load the +3.3 and +5 V rails more than the +12 V, even though this unit is of course more oriented towards +12 V applications. Because of that the voltage varies more than usual, but overall it still seems that the voltage on most of the positive positive rails is still somewhat higher than nominal. The highest variance from nominal was reached on the +12 V rail at 12.36 V which is exactly +3 %.
| Output power | Load/ voltage +5 V SB | Load/ voltage +3.3 V | Load/ voltage +5 V | Load/ voltage +12 V | Load/ voltage −12 V | Input power | Efficiency/power factor |
| 12 %/ 28.80 W | 0 A/ 5.12 V | 0.062 A/ 3.38 V | 0.323 A/ 5.11 V | 1.900 A/ 12.30 V | 0.306 A/ −11.64 V | 37.6 W | 76.6 %/ 0.79 |
| 20 %/ 51.24 W | 0.549 A/ 5.10 V | 1.537 A/ 3.37 V | 0.324 A/ 5.12 V | 3.37 A/ 12.27 V | 0.307 A/ −11.68 V | 67.6 W | 75.8 %/ 0.91 |
| 40 %/ 103.27 W | 1.04 A/ 5.07 V | 2.90 A/ 3.36 V | 3.38 A/ 5.05 V | 5.76 A/ 12.36 V | 0.311 A/ −11.86 V | 128.3 W | 80.5 %/ 0.97 |
| 60 %/ 148.67 W | 1.92 A/ 5.03 V | 5.11 A/ 3.35 V | 4.84 A/ 5.03 V | 7.86 A/ 12.36 V | 0.313 A/ −11.93 V | 178.7 W | 83.2 %/ 0.98 |
|
80 %/ 203.18 W |
2.50 A/ 5.00 V | 5.79 A/ 3.33 V | 6.00 A/ 5.02 V | 11.15 A/ 12.33 V | 0.316 A/ −12.02 V | 243.8 W | 83.3 %/ 1 |
| 100 %/ 252.67 W | 2.85 A/ 4.98 V | 5.98 A/ 3.33 V | 6.66 A/ 5.03 V | 14.77 A/ 12.27 V | 0.316 A/ −12.10 V | 305.6 W | 82.7 %/ 1 |
As for the efficiency, we reached over 83 % so I think that the claimed 85 % peak may be realistic, taking into consideration the margin of error on my current wattmeter (which tends to measure on the higher side). Judging from the fact that I reached maximum efficiency during test five (80% load), it is clear that this unit’s real continuous power is actually nearer to 300 W than 250 W. I am not exactly sure why Xilence down-rated it to 250W unit when even the original manufacturer specifies it as a 270W unit. Maybe they thought they’d last longer this way and they’d see less RMAs?
Combined loading ripple
The ripple of the XP400R6 was very low throughout most of the testing, however, under full load it already increased significantly. The higher the power, the higher the ripple will be so it seems that perhaps Xilence’s 250 W rating may not have been such a bad choice after all.
| Output % | Ripple +5 V SB | Ripple +3.3 V | Ripple +5 V | Ripple +12 V | Ripple −12 V |
| 12 | 14.0 mV | 13.2 mV | 16.4 mV | 25.2 mV | 25.6 mV |
| 20 | 16.0 mV | 12.4 mV | 16.0 mV | 29.2 mV | 29.6 mV |
| 40 | 18.8 mV | 14.0 mV | 20.0 mV | 40.4 mV | 24.4 mV |
| 60 | 24.8 mV | 14.4 mV | 25.6 mV | 49.6 mV | 22.4 mV |
| 80 | 26.8 mV | 16.4 mV | 28.8 mV | 52.0 mV | 25.6 mV |
| 100 | 39.2 mV | 26.0 mV | 39.2 mV | 47.2 mV | 31.6 mV |
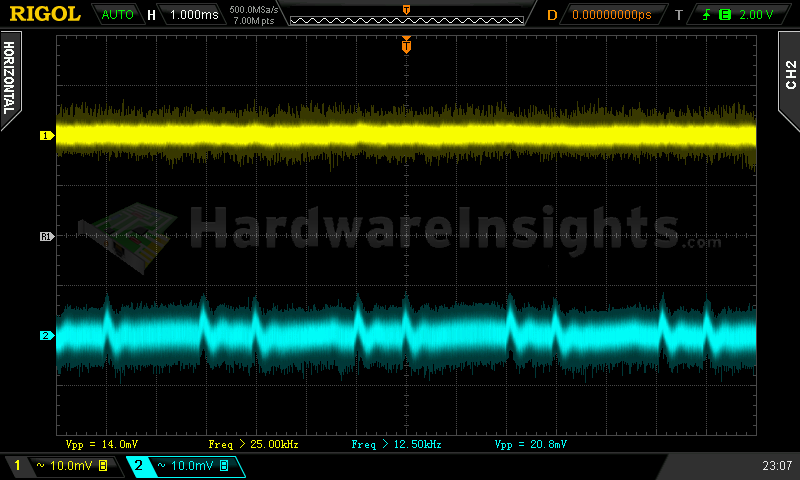
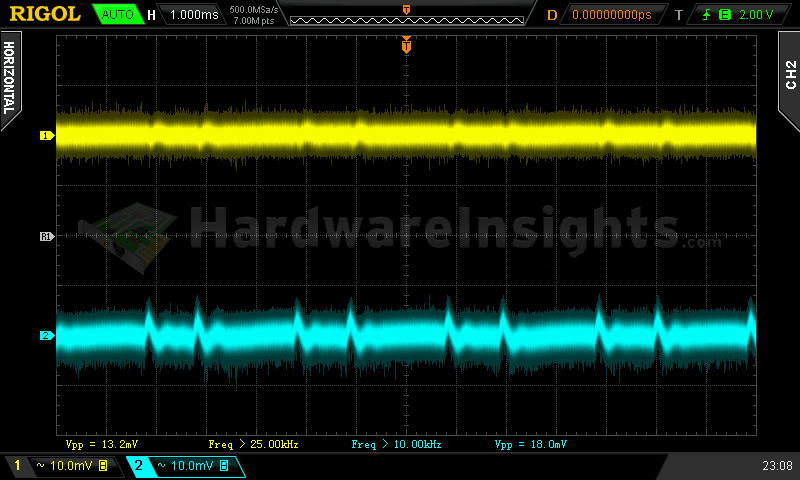
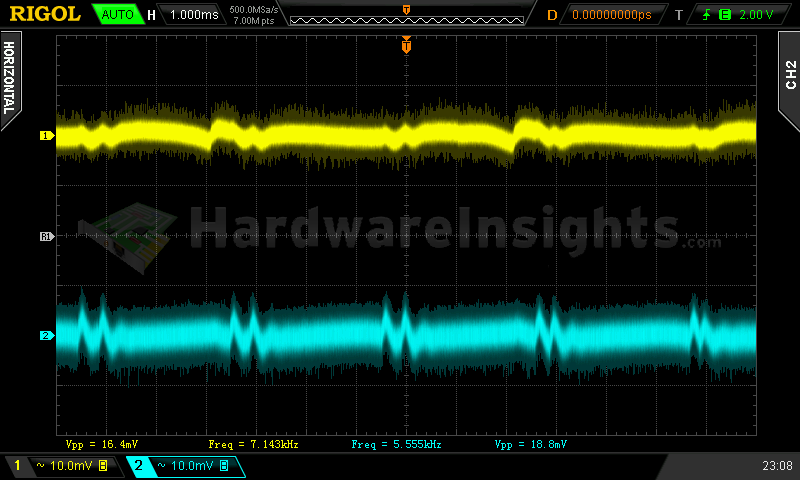
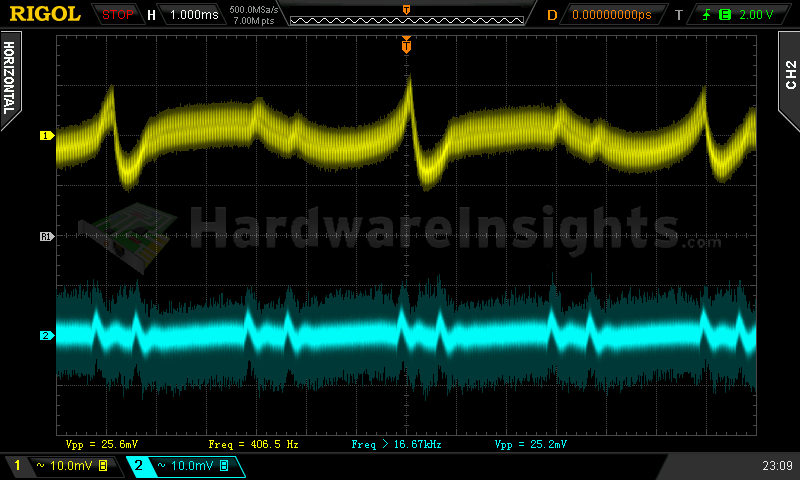
Ripple 12% load (left to right): +5 V SB; +3.3 V; +5 V; −12 V . The second channel is connected to +12 V.
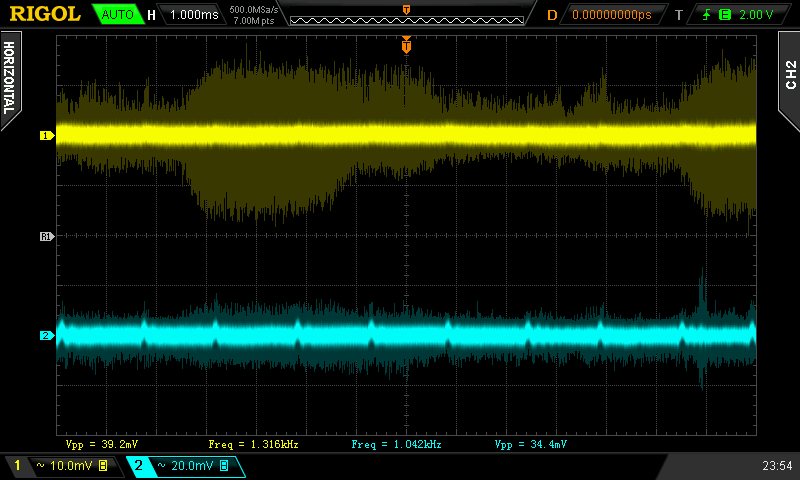
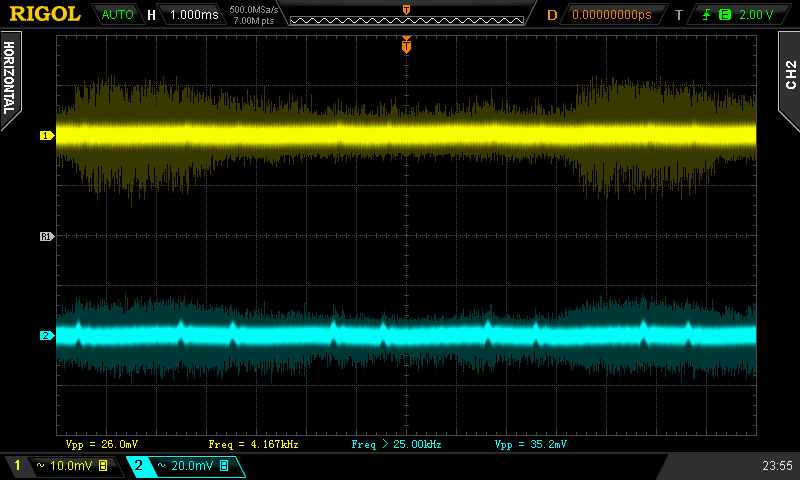
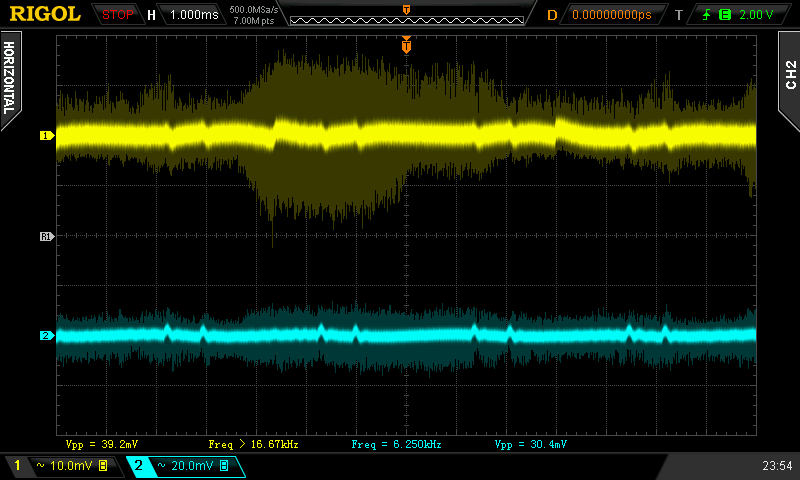
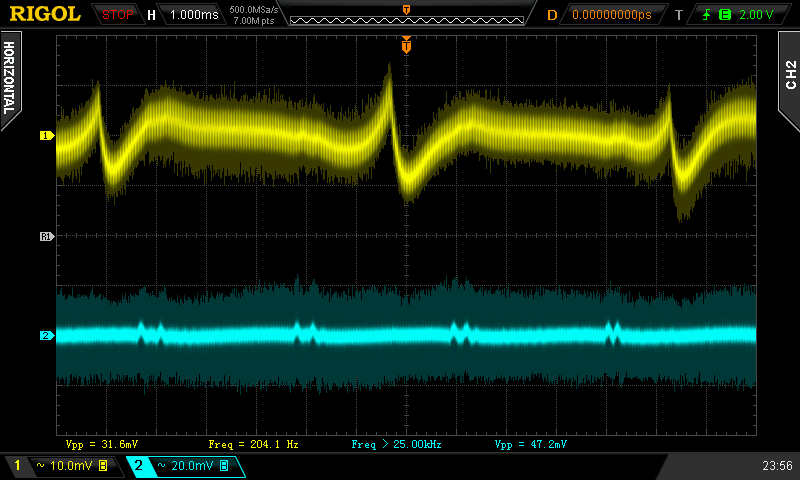
Ripple 100% load (left to right): +5 V SB; +3.3 V; +5 V; −12 V. The second channel is connected to +12 V.
Crossloading, overloading
Crossloading tests brought out of the worst of group design, which was expected. The +5 V rail failed under crossloading tests when the +12 V went as high as 12.69 V. I even tried to add a 1.5A load on the +12 V rail and the voltage was still at 12.65 V. Now Intel’s recommended power distribution graph is somewhat antiquated when it comes to today’s computers, but according to it, at over a 40 W draw from the +12 V, I should be able to get more than double the power from the +3.3 and +5 V combined than I am getting here. The voltage at +5 V could have dropped further to keep the +12 V lower. If the unit cannot do crossloading properly, than Huizhou Sinhuiyuan Technology should have opted for a different power distribution strategy. I think that 10 A for +3.3 V rail, 8 A for +5 V rail and 16 A for +12 V would be much more realistic. Or they should have provided minimum loading guidelines for crossloading as Silverstone does (well, after some troubles in this area ![]() ), I would have been willing to accept that.
), I would have been willing to accept that.
| Output power | Load/ voltage +5 V SB | Load/ voltage +3.3 V | Load/ voltage +5 V | Load/ voltage +12 V | Load/ voltage −12 V | Input power | Efficiency/power factor |
| 28 %/ 70.72 W | 0.547 A/ 5.10 V | 9.88 A/ 3.30 V | 1.500 A/ 5.05 V | 1.944 A/ 12.40 V | 0.310 A/ −11.74 V | 92.6 W | 76.4 %/ 0.96 |
| 42 %/ 104.74 W | 0.543 A/ 5.10 V | 1.527 A/ 3.37 V | 10.12 A/ 4.86 V | 3.47 A/ 12.65 V | 0.312 A/ −12.03 V | 129.2 W | 81.1 %/ 0.97 |
| 78 %/ 195.79 W | 0.543 A/ 5.10 V | 1.519 A/ 3.37 V | 1.546 A/ 5.18 V | 14.6 A/ 12.06 V | 0.311 A/ −11.90 V | 232.7 W | 84.1 %/ 0.99 |
| 160 %/ 400.89 W | 3.29 A/ 4.95 V | 5.91 A/ 3.32 V | 9.12 A/ 4.86 V | 27.3 A/ 11.61 V | 0.316 A/ −11.88 V | 503.6 W | 79.6 %/ 1 |
As it is, I cannot let the unit pass as this regulation is really bad. And we only drew about 100 W from the unit…overloading tests revealed that despite them claiming that the unit has over-power protection, the best it can do is maybe power limiting. Because after reaching approx. 405 W of output power, further increases only resulted in a heavy voltage drop. This continued with the voltage dropping all the way down to about 9.5 V on the +12 V rail. It was only then when the supervisor IC finally realized something is going on and kicked in. This is absolutely unacceptable for OPP and UVP. No computer could work with less than maybe 11 V, and here it went all the way down to 9.5 V? What is such “protection” worth? This can result in serious damage to peripherals, especially to hard-disk drives. The Power Good signal was present the whole time, of course. The only positive thing I can mention here is that the unit managed to survive for 15 minutes in the sweater test. It reached almost 40 °C on the output and the fan speed was over 1600 RPM.
Crossloading, overloading ripple
Ripple however managed to stay in spec under all the tests. I am sure there is potential in this platform, it only needs some fine-tuning.
| Output % | Ripple +5 V SB | Ripple +3.3 V | Ripple +5 V | Ripple +12 V | Ripple −12 V |
| 28 | 14.4 mV | 15.6 mV | 15.6 mV | 30.0 mV | 27.2 mV |
| 42 | 16.8 mV | 14.4 mV | 17.2 mV | 40.0 mV | 29.2 mV |
| 78 | 22.4 mV | 12.4 mV | 22.0 mV | 40.8 mV | 24.0 mV |
| 160 | 49.6 mV | — | — | 31.2 mV | — |
Fan speed and temperatures
This unit’s fan started spinning right after turning the PSU on. The speed rose continuously up to approx. 1450 RPM. The fan’s maximum RPM seems to be higher than I initially predicted – at slightly over 1600 RPM. I guess it was spinning this fast because the transformer was already hot from the overload tests, and it needs to spin fast in order to keep the capacitors cool. Afterall, Kingkong does not like heat Kingcon capacitors do not like heat!
| Output % | Fan speed (RPM) | Temperature intake/ outtake |
| 12 | 696 | 23 °C/ 24 °C |
| 20 | 714 | 24 °C/ 25 °C |
| 40 | 848 | 24 °C/ 26 °C |
| 60 | 1133 | 24 °C/ 27 °C |
| 80 | 1305 | 25 °C/ 28 °C |
| 100 | 1456 | 25 °C/ 30 °C |
| CL 28 | 984 | 24 °C/ 28 °C |
| CL 42 | 1076 | 24 °C/ 27 °C |
| CL 78 | 1306 | 25 °C/ 29 °C |
| OL 160 | 1612 | 27 °C/ 36 °C |

